We provide a comprehensive and high-fidelity dataset of planar pushing experiments. The dataset contains timestamped poses of a pusher and a pushed object, as well as forces at the interaction. The push interaction varies in 6 dimensions: surface material, shape of the pushed object, contact position, pushing direction, pushing speed, and pushing acceleration.
[1] Paper on dataset: Peter KT Yu, Maria Bauza, Nima Fazeli, and Alberto Rodriguez. More than a Million Ways to Be Pushed: A High-Fidelity Experimental Dataset of Planar Pushing. Best Paper Award Finalist at IROS 2016 (arXiv).
[2] Paper on modeling: Maria Bauza and Alberto Rodriguez. A probabilistic data-driven model for planar pushing. ICRA 2017 (arXiv).
Contact: Peter KT Yu, Maria Bauza
New: an extended version of the dataset with 250 objects and RGB-D video is now available. For more details, check the Omnipush website.
Comprehensive dataset [1]
We record each straight push in .json and .h5 formats. For each data file, we provide a rendered files in png with the same basename for users to visualize the push. We archived the files based on its surface material and object shape.
- Main comprehensive pushing dataset the files are grouped by surface materials: abs, delrin, pu, plywood.
- Repeated pushing dataset the set of repeated trajectories described in paper [1]. (link).
Each data file corresponds to one straight push and contains the interaction forces and the positions of the object and the pusher. In particular, each file contains three kinds of measurement:
- tip_pose: contains a sequence of tip positions. Each measurement contains the time in second, the x and y position in meters of the center of the tip with respect to the robot frame and the orientation of the tip in radians.
- obj_pose: contains several measurements of the object position. Each measurement contains the time in second, the x and y position of the center of the object with respect to the robot in meters and its orientation in radians.
- ft_wrench: provides the force excerted on the pusher. Each measurement contains the time in second and the force in x and y in Newton, and torque in z in Newton*meters.
The conventions used to define the centers of the objects and their orientation will be explained later. Note the time is not synchronized among the three measurements. We suggest to use resample() function in matlab or pandas in python to synchronize them.
Friction map data: the image data for Fig 3 (a) in the paper is now available here.
Validation dataset for modeling [2]
This new data set contains 100 repetitions of each push considered. The pusher follows a straight trajectory of 1cm long at 20mm/s and the pushed object is 'rect1'. The type of push considered have diferent initial contact angles and contact points:
- Contact angles: -1.5, -1.4, -1.3, ..., +1.5 radians
- Contact points: 0, 0.1, 0.2, ..., 1 on side 0 of 'rect1'
A few instances of data were not well-recorded. The name of those files are listed here.
Data capturing setup
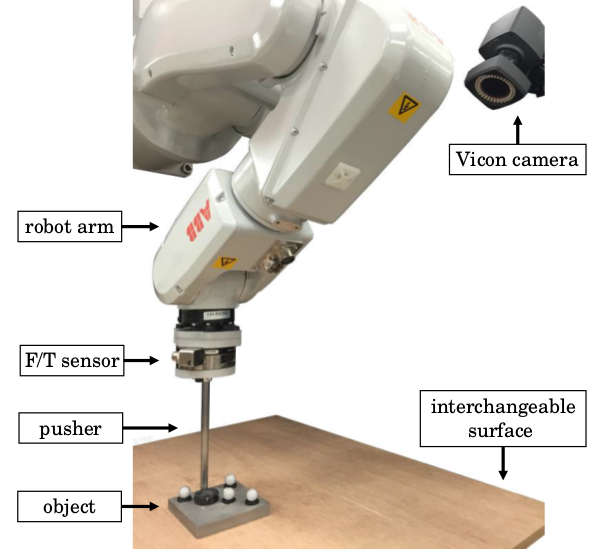
About the surfaces
Here are the links to the surface materials we used from McMaster (US vendor).
abs Easy-to-Machine ABS Shapes, 1/2" Thick, 24" x 24", Black
delrin White Delrin ® Acetal Resin Sheet, 1/2" Thick, 24" x 24"
plywood Marine-Grade Plywood Sheet, 24" x 24" x 1/2"
pu Abrasion-Resistant Polyurethane Rubber Sheet, Semi-Clear, 24" x 24", 1/4" Thick, 80A Durometer
File naming convention: using rect1 as example
Each file has a file name containing fields of
- a (acceleration in mm/s^2),
- v (velocity in mm/s),
- i (side number, starting from 0),
- s (initial contact point position on that side, ranging from 0 to 1),
- t (initial contact angle in rad).
The following picture illustrate the side number, contact point position and contact angles.
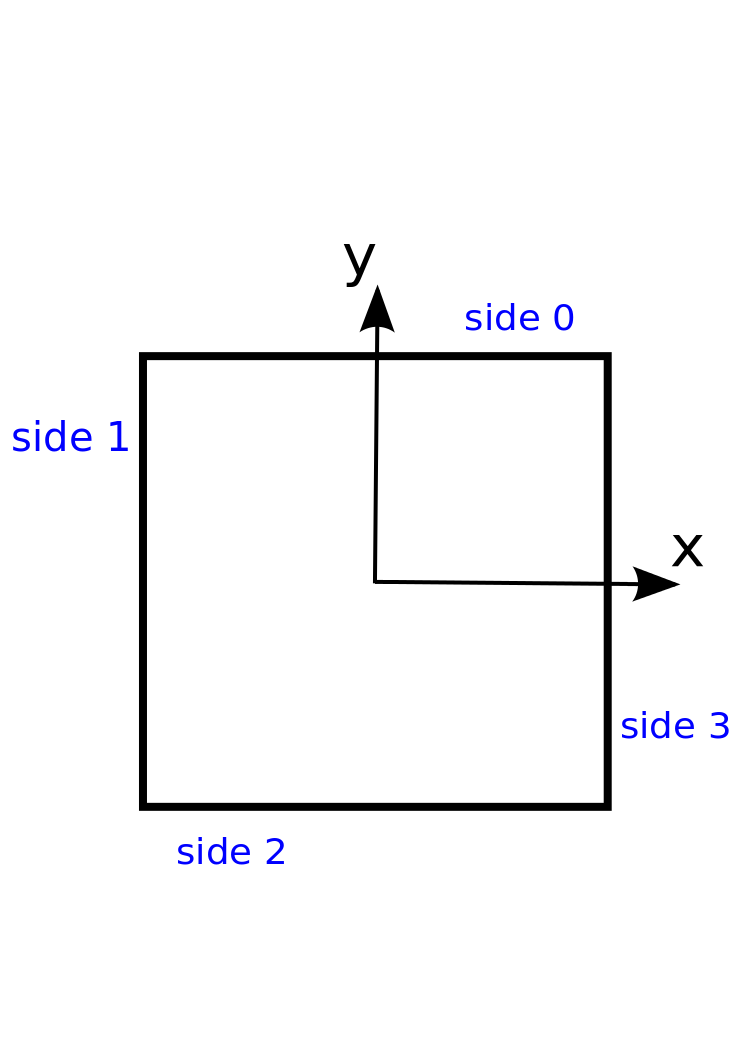
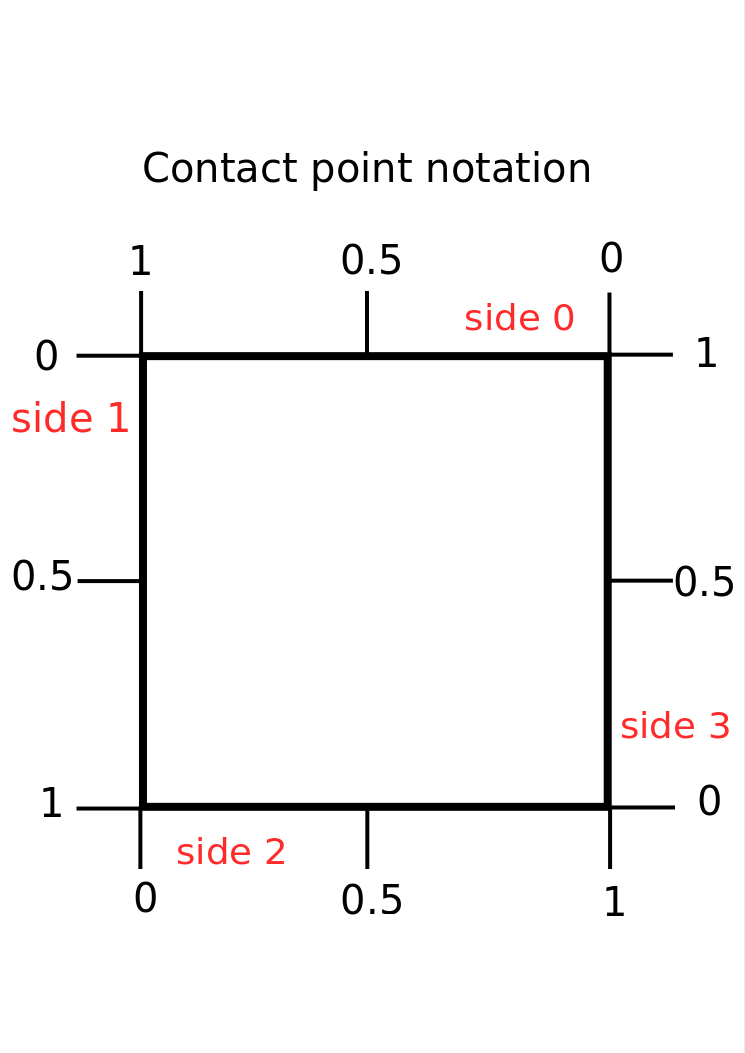
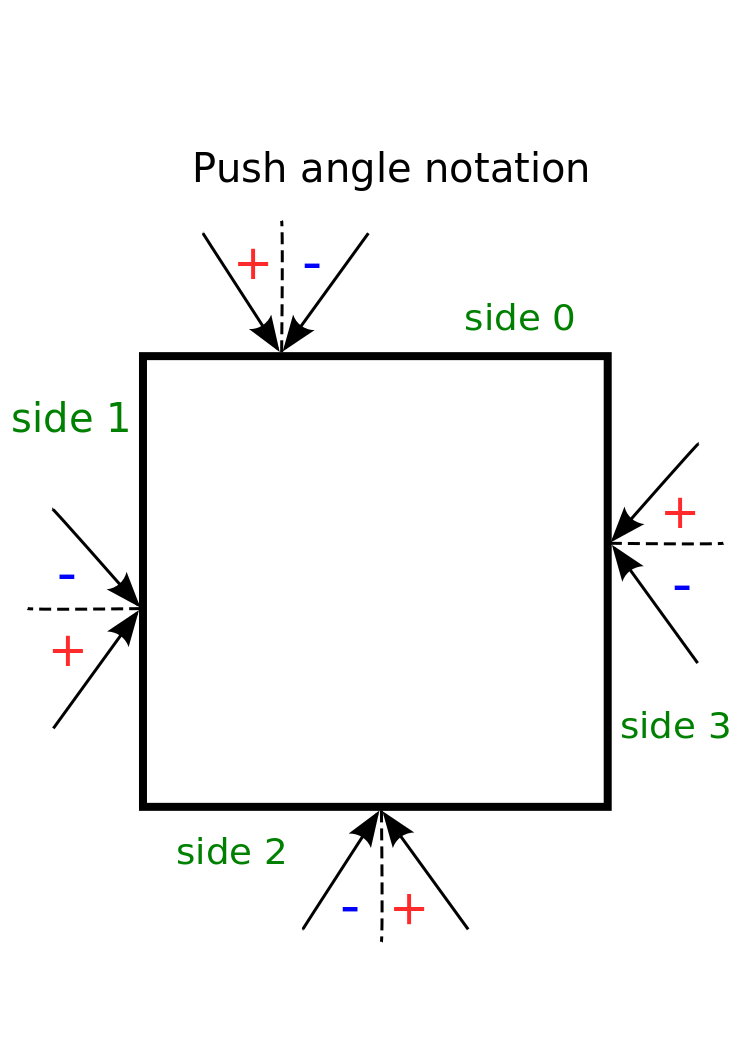
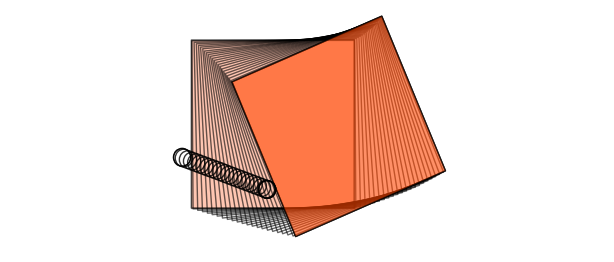
For example: file 'motion_surface=plywood_shape=rect1_a=0_v=20_i=1.000_s=0.700_t=-0.349.h5' records a push that starts at side 1, at the contact point 0.7 and with an angle of -20 degrees (0.349 rad). The pusher follows a straight line without accelartion and with a constant velocity of 20 mm/s. The trajectory of the pusher and the object looks like:
About the objects
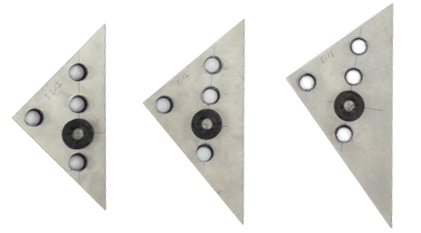
We have used 11 objects. In the picture below, from left to right are rect1, rect2, rect3, hex, tri1, tri2, tri3, ellip1, ellip2, ellip3, and butter.


Download Mesh models
Object Shape Description
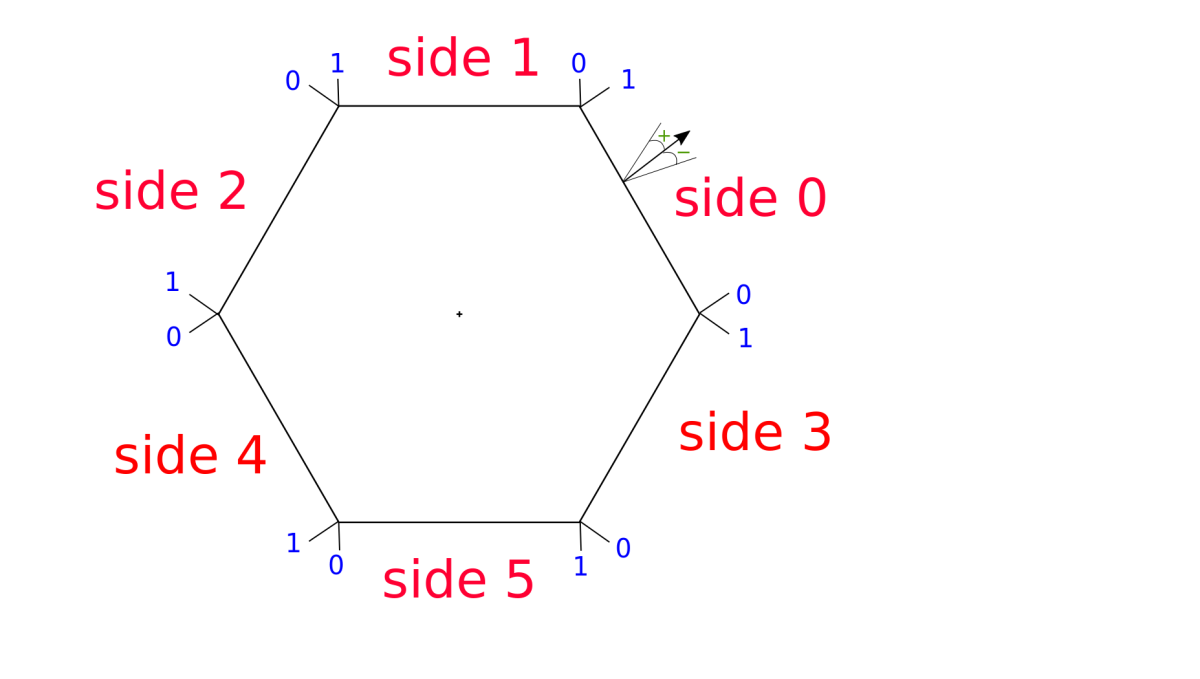
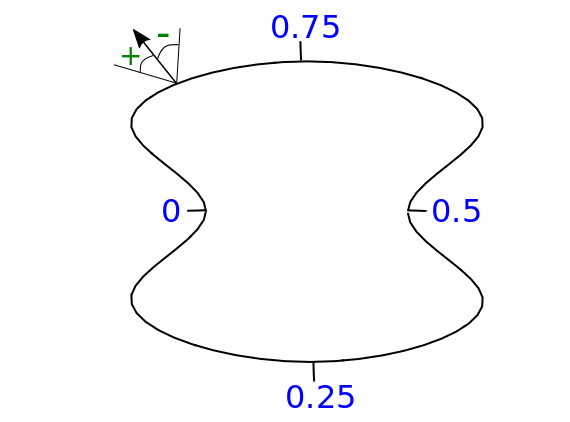
Dimensions are given in meters. In the following figures, the blue numbers illustrate the contact-point position and the green signs (+, -) illustrate the angles of pushing.
Rect
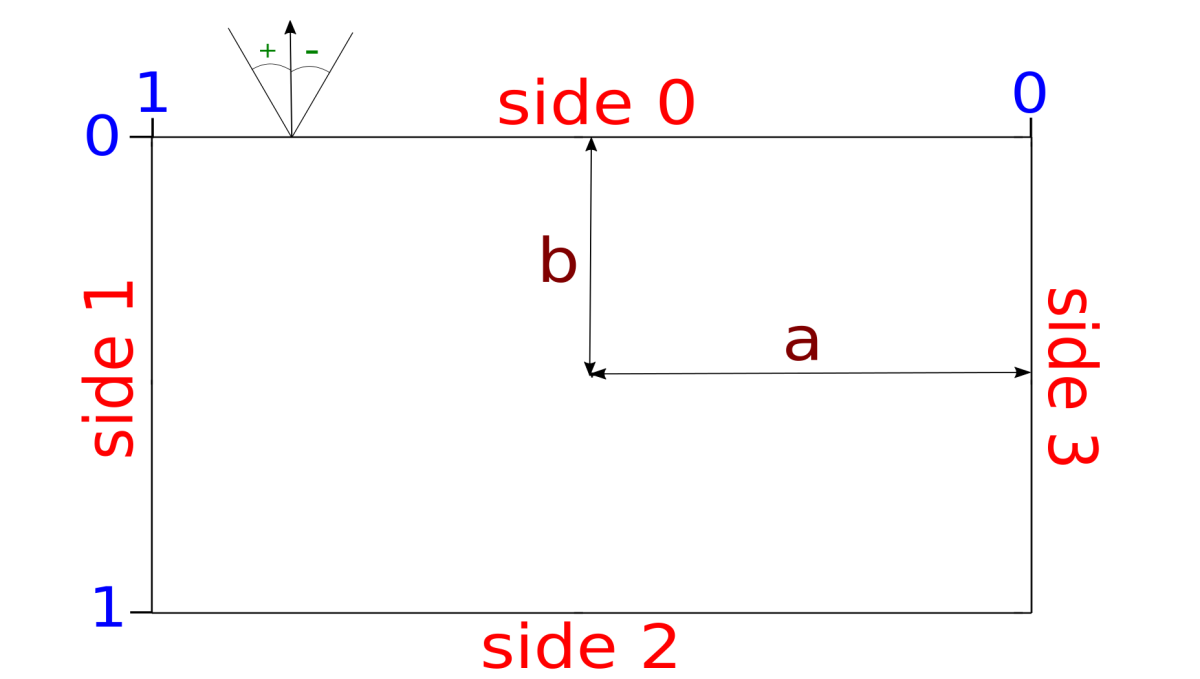
| rect1: a= 0.0450 , b= 0.0450 |
| rect2: a= 0.0450 , b= 0.0563 |
| rect3: a= 0.0675 , b= 0.0450 |
Ellip
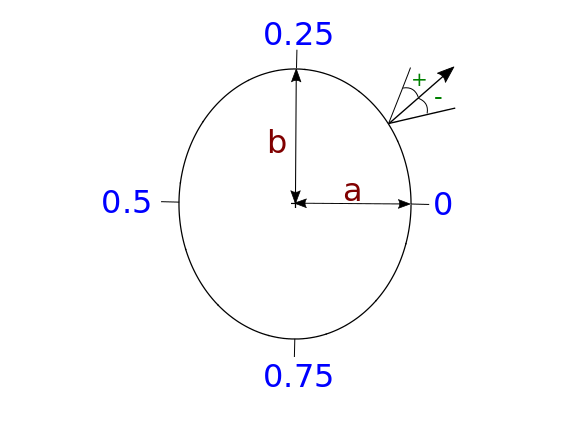
| ellip1: a= 0.0525 , b=0.0525 |
| ellip2: a= 0.0525 , b= 0.0654 |
| ellip3: a= 0.0525 , b= 0.0785 |
Tri
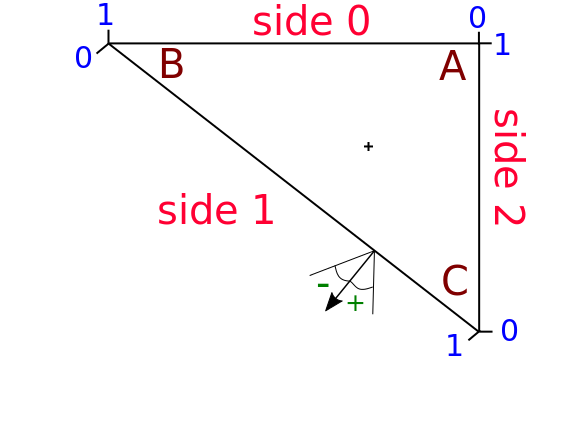
| tri1: A= (0.0450, 0.0450), B = (-0.0809, 0.0450), C = (0.0450, -0.0809) |
| tri2: A= (0.0450, 0.0450), B = (-0.1060, 0.0450), C = (0.0450, -0.0809) |
| tri3: A= (0.0450, 0.0450), B = (-0.1315, 0.0450), C = (0.0450, -0.0806) |
Hex
Each side measures: 0.0605 m
Butter
Code
New data preprocessing and rendering scripts in Python are available at this pdproc github repo.
Please cite the paper
Combining learned and analytical models for predicting action effects from sensory data when using the rendering scripts. Thanks Alina Kloss!
The preprocessing script - removes redundant data entries - treats some (not all) of the jumps in object orientation - transforms the orientation to [-pi, pi] - synchronizes the data by resampling to a given frequency - sets the initial object position and orientation to zero - adds information about the push (angle, velocity...) to the h5 data files
The rendering script renders RGB-D images from the data.
Here is the old repo for the dataset. You can find out the details of data collection process or useful python and matlab scripts to analyze the data. We will gradually migrate files to the new repo so that it is more organized.